

Not All Growth Reads the Same
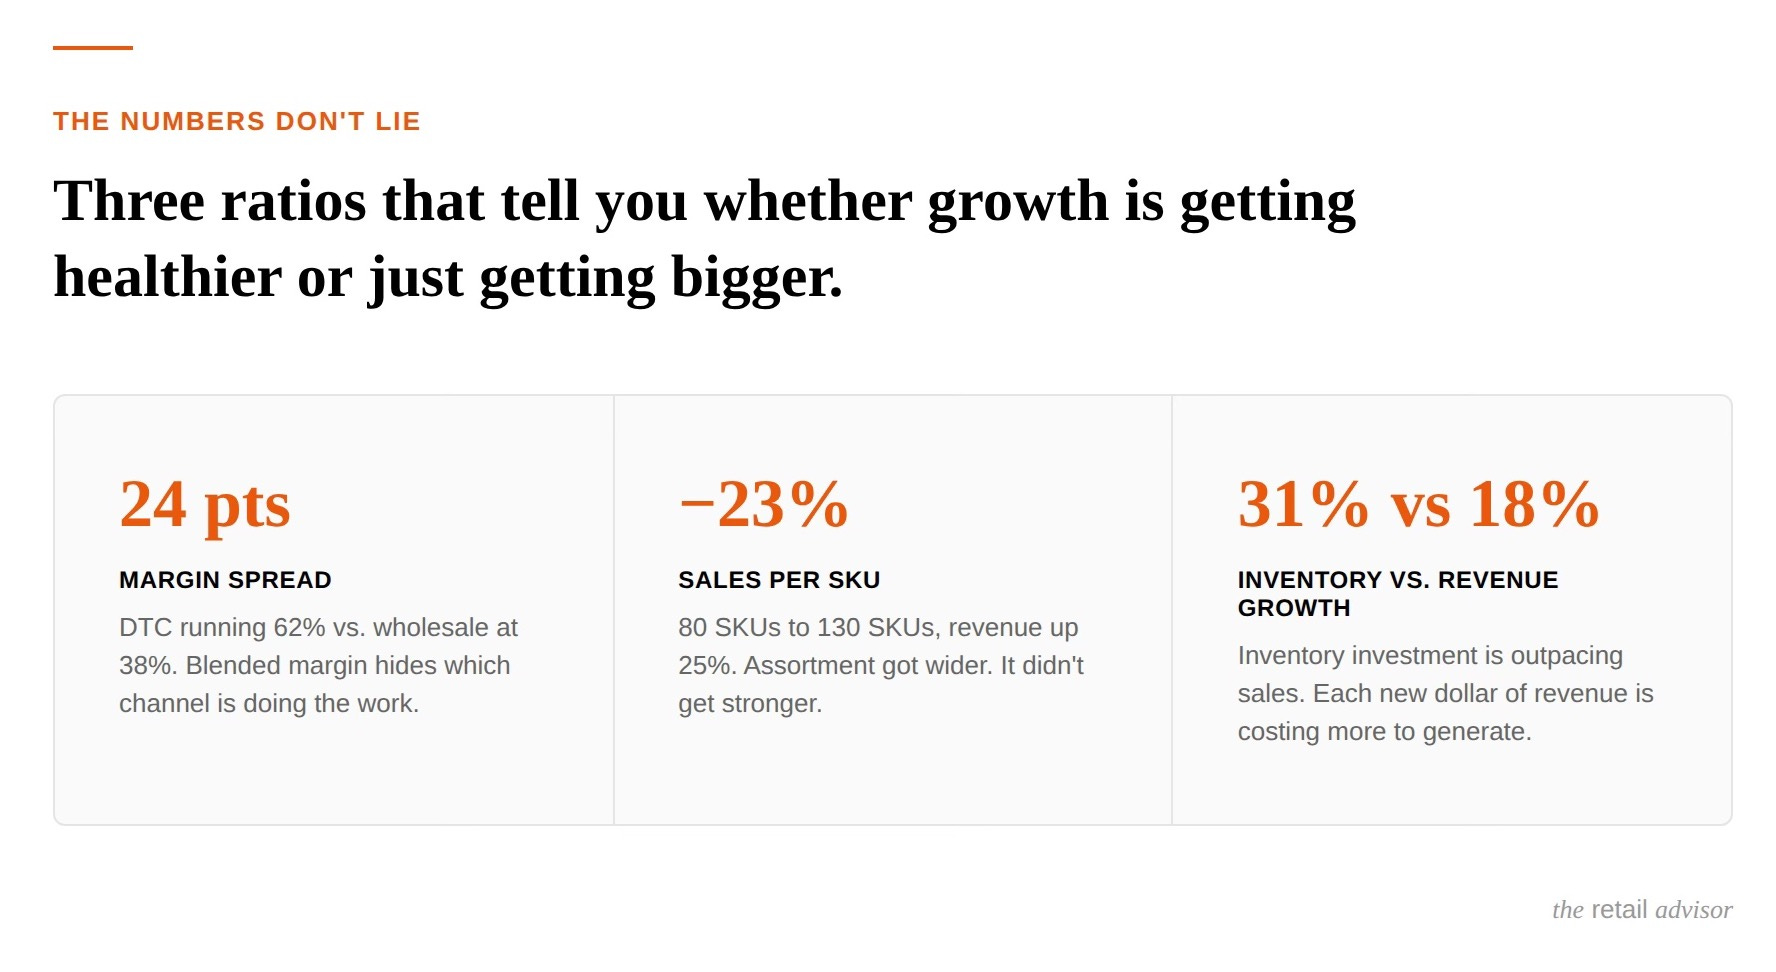
Three ratios that tell you whether growth is getting healthier, or just getting bigger.

Revenue went up 40% this year. So did the credit line.
The number that hides the other three
Most founders track one number closely: top-line revenue. It’s the number on the bank statement, the one that gets celebrated in the founder update, the one investors and friends ask about first. It’s also the number that tells you the least about whether the business is actually getting healthier.
Revenue growth can come from three very different places: more full-price sell-through, more discounting to move volume, or more inventory sitting on the balance sheet waiting to sell. All three show up as the same top-line number. Only one of them is growth you’d want more of.
Metric 1: Margin by channel
A brand doing $4M with 55% blended gross margin looks fine until you split it by channel. DTC might be running at 62%. Wholesale might be sitting at 38% after markdown allowances and chargebacks. If wholesale is growing faster than DTC, the blended number degrades even while total revenue climbs. The founder sees “we grew 40%.” The P&L is quietly telling a different story: the mix shifted toward the channel that makes less on every unit.
Track margin by channel monthly, not blended. Blended margin is an average of two businesses with different economics, and averages hide the one that’s dragging.
Pulling it in Shopify: Analytics > Reports > Profit reports gives you Gross profit by product and Profit margin by order, but neither breaks cleanly by sales channel on its own. Cross the Sales by channel report (Analytics > Reports > Sales) against your Profit margin by order report for the same date range, filtered to each channel, to get a directional split. One caution worth knowing before you build this: Shopify’s cost-per-item field is static, so a discounted item shows an inflated margin in the Gross profit by product report during the promo period. If wholesale runs heavier markdowns than DTC, your Shopify-reported wholesale margin will run optimistic. Treat it as directional, not exact.
Metric 2: SKU productivity
Revenue growth from adding SKUs isn’t the same as revenue growth from selling more of what’s working. A founder who goes from 80 SKUs to 130 SKUs and grows revenue 25% hasn’t necessarily built a stronger assortment. If sales per SKU actually declined, the growth came from breadth, not depth, and breadth carries carrying cost, markdown risk, and operational drag that depth doesn’t.
Sales per SKU, and the trend on it quarter over quarter, tells you whether growth is coming from the assortment working harder or just getting wider.
Pulling it in Shopify: Analytics > Reports > Sales by product. Pull net sales and net units sold by SKU for the period, then divide total net sales by active SKU count to get your average sales per SKU. Run the same report for the prior comparable period and compare the two averages. If SKU count grew faster than the average, breadth is outpacing depth.
Metric 3: Working capital versus revenue growth
This is the one that catches up to founders latest and hurts most. If inventory investment is growing faster than revenue, the business is spending more to generate each incremental dollar of sales. That’s not a red flag by itself, categories with long lead times often need to build inventory ahead of demand, but it needs to be a conscious tradeoff, not a discovery made at year-end when cash is tighter than the P&L suggested it should be.
The ratio to watch: inventory growth rate versus revenue growth rate. When inventory is consistently outpacing revenue, the business is quietly getting less efficient at converting cash into sales, even as the top line looks strong.
Pulling it in Shopify: Analytics > Reports > Inventory reports for a month-end inventory value snapshot (or sell-through rate, if you want it by product), and Analytics > Reports > Sales over time for revenue by the same period. Shopify won’t calculate the ratio for you, this is a manual pull twice a year at minimum, ideally quarterly. Compare inventory dollar value at period-end against revenue for that period, then look at the trend across two or three periods rather than a single snapshot.
A caveat worth sitting with
None of these three numbers come out of Shopify clean. Every pull above requires cross-referencing two reports, and every one of them is only as good as what got entered when the product was received.
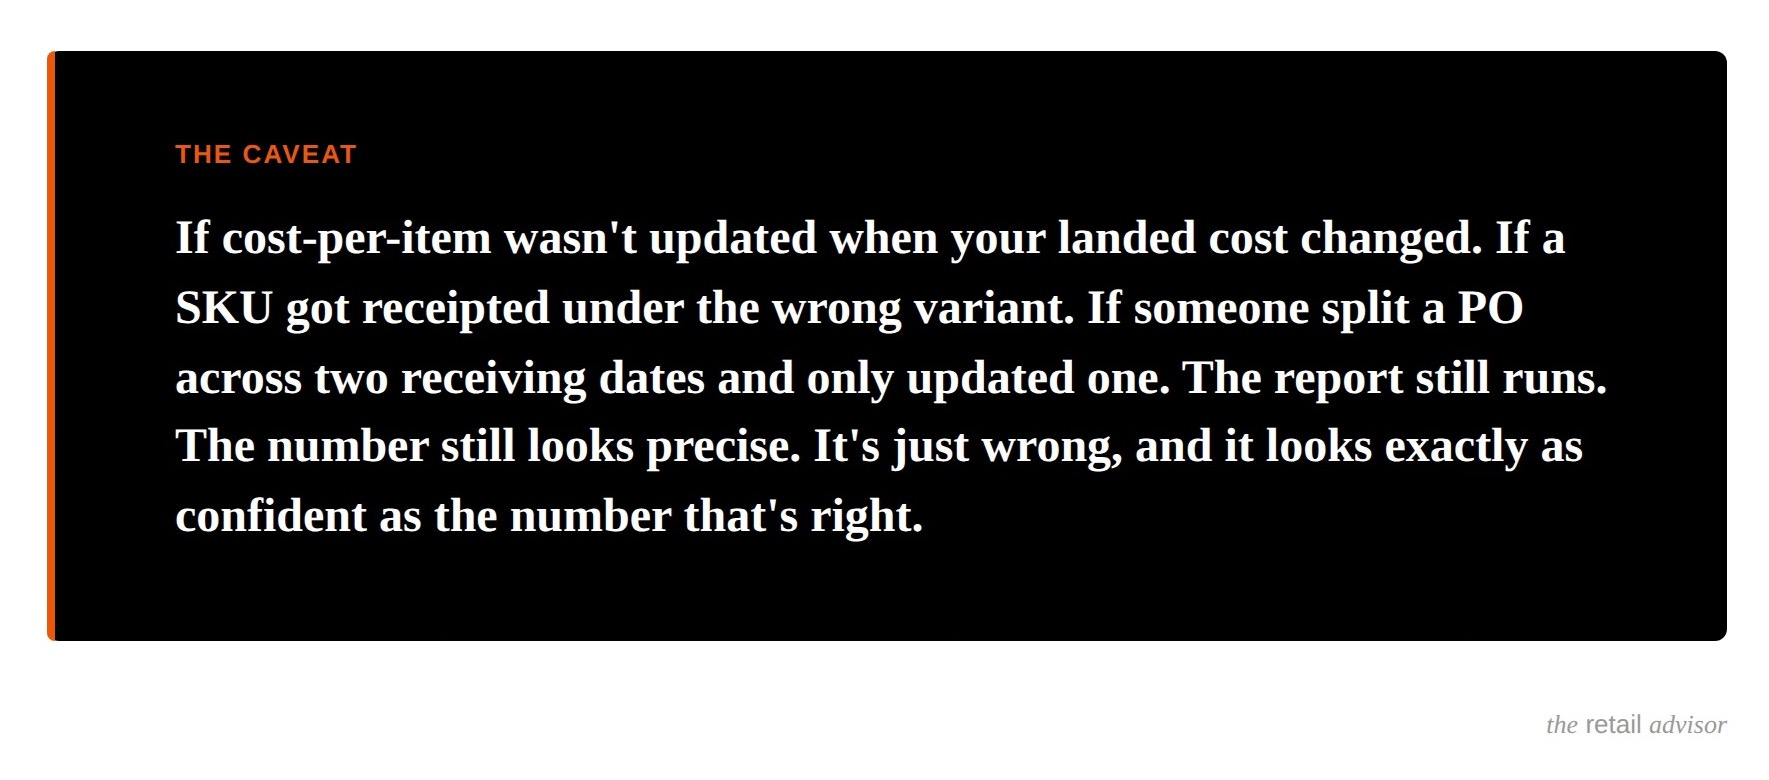
If cost-per-item wasn’t updated when your landed cost changed. If a SKU got receipted under the wrong variant. If someone split a PO across two receiving dates and only updated one. The report still runs. The number still looks precise. It’s just wrong, and it looks exactly as confident as the number that’s right.
This is garbage in, garbage out, and Shopify won’t flag which one you’re looking at. It doesn’t know the difference between a correct margin and a stale cost field. Only a person who understands both the numbers and where Shopify’s reporting breaks down catches it before it becomes a decision.
Remember: None of these three numbers show up on a standard P&L review. All three show up on a bank statement eventually, just later than you’d like, and by then they’re a cash problem instead of a numbers problem. And the software won’t warn you when the number it’s showing you is wrong.
If you want help understanding your top sellers or product hierarchy, book a free 30-minute intro call with me to discuss your brand’s needs.



